
Key facts
- On September 1, 2026, 3,074 residential NFIP flood policies were in force across the 20 Nashville ZIP codes on this map, for about 247,584 homes: roughly 1.2% (calculated by Nashville Water Damage & Mold on November 14, 2026). FEMA OpenFEMA NFIP Redacted Policies and Claims v3
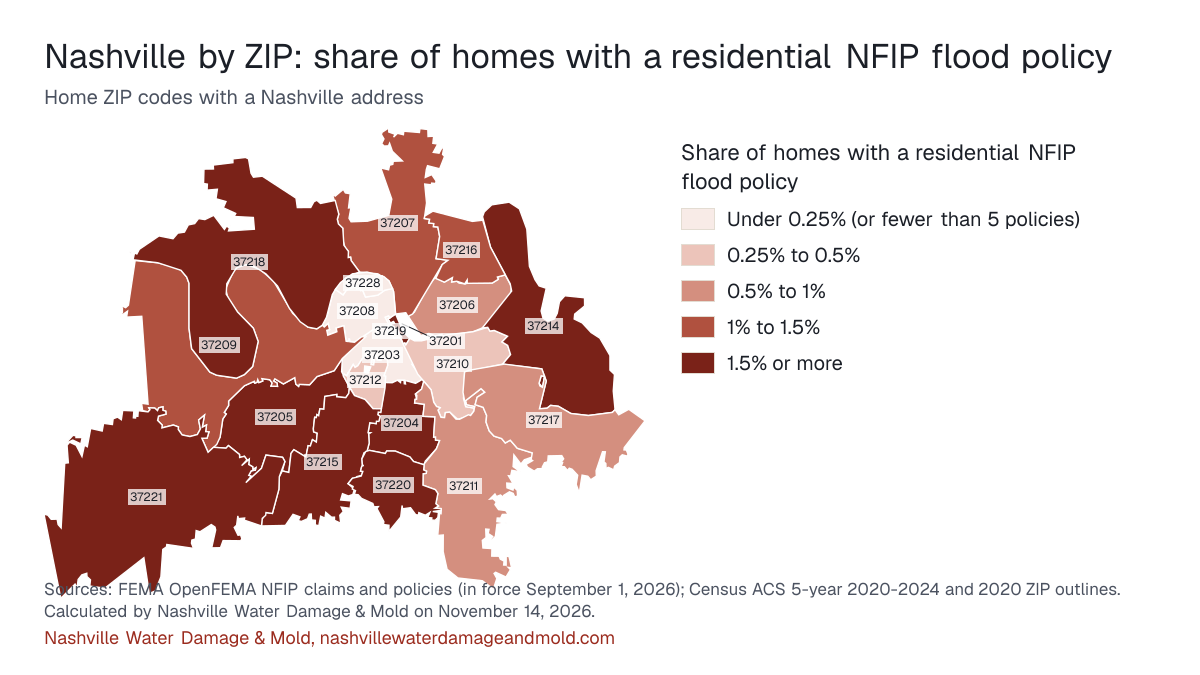
- As of September 1, 2026, ZIP 37215 has the largest share of homes with an NFIP flood policy among Nashville's ZIPs, 3.08% (calculated by Nashville Water Damage & Mold on November 14, 2026). FEMA OpenFEMA NFIP Redacted Policies and Claims v3
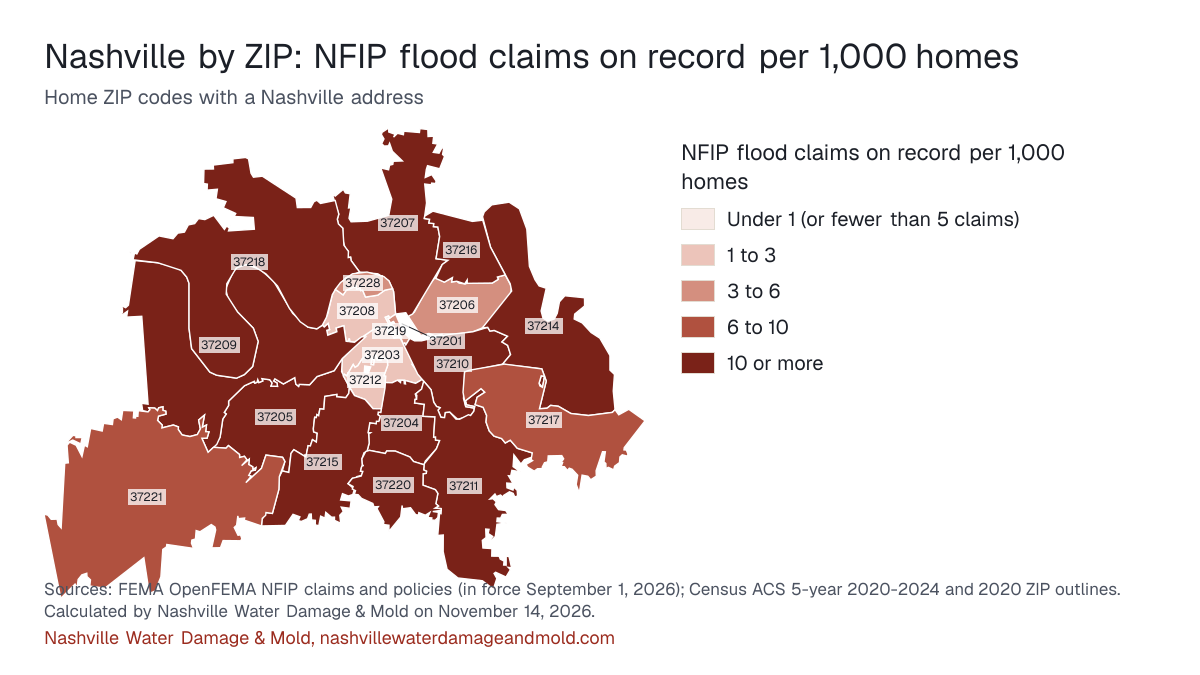
- FEMA lists 3,727 NFIP flood claims in these Nashville ZIPs and $144,487,437 paid on buildings and contents; 37211 leads with 682 (calculated by Nashville Water Damage & Mold on November 14, 2026). FEMA OpenFEMA NFIP Redacted Policies and Claims v3
- Per home, ZIP 37204 has the most NFIP claims on record in Nashville, about 50.3 for every 1,000 homes (calculated by Nashville Water Damage & Mold on November 14, 2026). FEMA OpenFEMA NFIP Redacted Policies and Claims v3
- Davidson County has been in the National Flood Insurance Program since 1982, and Metro bought 225 flood-damaged homes through a voluntary program after the May 2010 flood. Metro Water Services: Flood Insurance Fact Sheet (2017)
The map
Flood policies per home run from 0.07% in ZIP 37203 to 3.08% in ZIP 37215, among ZIPs with at least 5 policies. Use the buttons to change what the colors show; every number is also in the table below the map.
Share of homes with a residential NFIP flood policy
- Under 0.25% (or fewer than 5 policies)
- 0.25% to 0.5%
- 0.5% to 1%
- 1% to 1.5%
- 1.5% or more
NFIP flood claims on record per 1,000 homes
- Under 1 (or fewer than 5 claims)
- 1 to 3
- 3 to 6
- 6 to 10
- 10 or more
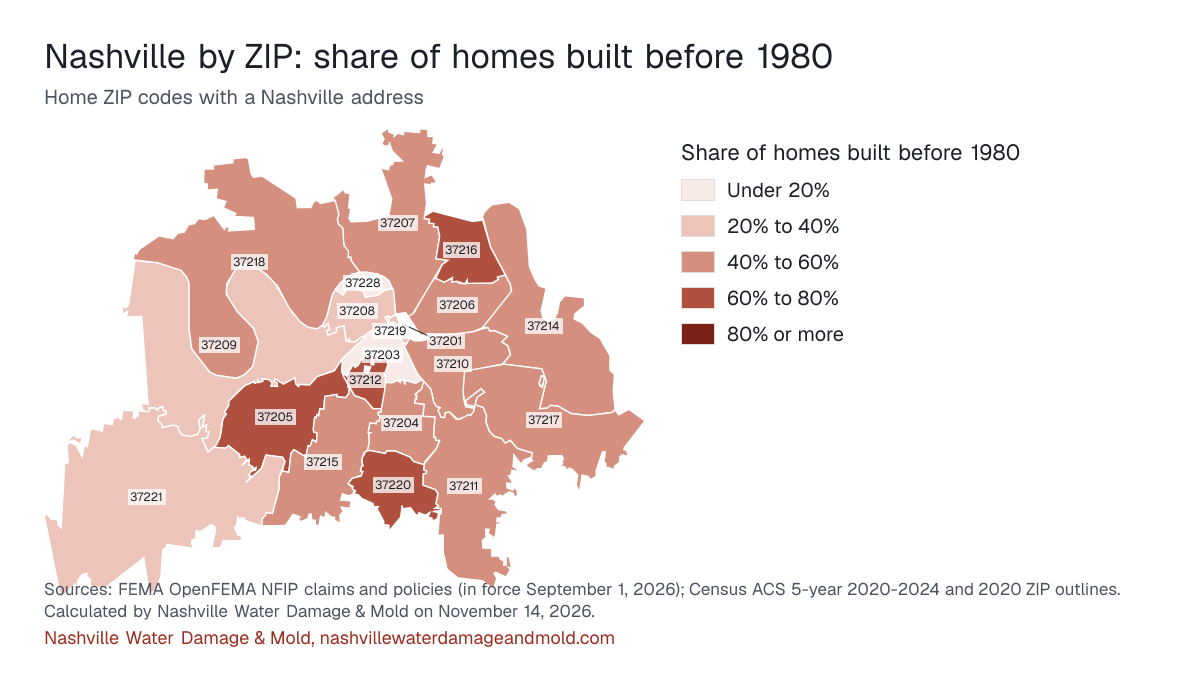
Share of homes built before 1980
- Under 20%
- 20% to 40%
- 40% to 60%
- 60% to 80%
- 80% or more
Sources: FEMA OpenFEMA NFIP claims and policies (in force September 1, 2026); Census ACS 5-year 2020-2024 and 2020 ZIP outlines. Calculated by Nashville Water Damage & Mold on November 14, 2026. Download image of the map, one per measure: flood policies per home, claims per 1,000 homes, homes built before 1980.
What these numbers can and can't tell you
Claims and policies are National Flood Insurance Program records only: private flood insurance, homeowners water claims and uninsured losses are left out. Policies count residential NFIP policies in force on September 1, 2026; one policy can cover a building with several homes, and renters can hold contents-only policies, so policies per home is an approximation. ZIP codes are as reported to FEMA. Counts under 5 show as "fewer than 5" with no dollar total or share. Homes come from Census ACS 5-year 2020-2024 estimates for ZIP Code Tabulation Areas, which approximate USPS ZIPs and carry margins of error. Land shares come from the Census 2020 ZIP-to-place file.
Every ZIP, in one table
| Area | |||||||
|---|---|---|---|---|---|---|---|
| 37211 | AreaSouth Nashville, Woodbine, Donelson and the airport side (99% of the land in Metro Nashville's general area) | NFIP claims682 | Total paid$22,002,658 | Flood policies in force284 | Homes with a policy0.79% | Median year built1980 | Built before 198049% |
| 37215 | AreaZIPs shared with Belle Meade, Forest Hills, Oak Hill and Berry Hill (42% of the land in Metro Nashville's general area) | NFIP claims408 | Total paid$7,113,071 | Flood policies in force348 | Homes with a policy3.08% | Median year built1980 | Built before 198050% |
| 37204 | AreaZIPs shared with Belle Meade, Forest Hills, Oak Hill and Berry Hill (64% of the land in Metro Nashville's general area) | NFIP claims403 | Total paid$10,636,745 | Flood policies in force195 | Homes with a policy2.43% | Median year built1993 | Built before 198045% |
| 37214 | AreaSouth Nashville, Woodbine, Donelson and the airport side (100% of the land in Metro Nashville's general area) | NFIP claims366 | Total paid$14,349,971 | Flood policies in force327 | Homes with a policy2.05% | Median year built1983 | Built before 198044% |
| 37207 | AreaEast Nashville and Inglewood (100% of the land in Metro Nashville's general area) | NFIP claims335 | Total paid$14,809,195 | Flood policies in force223 | Homes with a policy1.13% | Median year built1978 | Built before 198053% |
| 37209 | AreaWest Nashville and Bellevue (100% of the land in Metro Nashville's general area) | NFIP claims255 | Total paid$10,760,543 | Flood policies in force223 | Homes with a policy1.01% | Median year built1997 | Built before 198036% |
| 37205 | AreaZIPs shared with Belle Meade, Forest Hills, Oak Hill and Berry Hill (82% of the land in Metro Nashville's general area) | NFIP claims247 | Total paid$7,815,516 | Flood policies in force317 | Homes with a policy2.51% | Median year built1971 | Built before 198066% |
| 37218 | AreaNorth Nashville and Bordeaux (100% of the land in Metro Nashville's general area) | NFIP claims207 | Total paid$7,581,590 | Flood policies in force112 | Homes with a policy1.68% | Median year built1977 | Built before 198057% |
| 37221 | AreaWest Nashville and Bellevue (92% of the land in Metro Nashville's general area) | NFIP claims200 | Total paid$13,087,114 | Flood policies in force558 | Homes with a policy2.65% | Median year built1991 | Built before 198024% |
| 37216 | AreaEast Nashville and Inglewood (100% of the land in Metro Nashville's general area) | NFIP claims151 | Total paid$7,310,514 | Flood policies in force137 | Homes with a policy1.39% | Median year built1960 | Built before 198064% |
| 37210 | AreaSouth Nashville, Woodbine, Donelson and the airport side (100% of the land in Metro Nashville's general area) | NFIP claims145 | Total paid$16,314,811 | Flood policies in force38 | Homes with a policy0.40% | Median year built1976 | Built before 198054% |
| 37217 | AreaSouth Nashville, Woodbine, Donelson and the airport side (100% of the land in Metro Nashville's general area) | NFIP claims141 | Total paid$5,737,460 | Flood policies in force95 | Homes with a policy0.64% | Median year built1978 | Built before 198057% |
| 37206 | AreaEast Nashville and Inglewood (100% of the land in Metro Nashville's general area) | NFIP claims61 | Total paid$2,723,043 | Flood policies in force76 | Homes with a policy0.54% | Median year built1969 | Built before 198056% |
| 37220 | AreaZIPs shared with Belle Meade, Forest Hills, Oak Hill and Berry Hill (30% of the land in Metro Nashville's general area) | NFIP claims37 | Total paid$559,196 | Flood policies in force57 | Homes with a policy2.48% | Median year built1962 | Built before 198076% |
| 37203 | AreaDowntown and Midtown (100% of the land in Metro Nashville's general area) | NFIP claims25 | Total paid$389,546 | Flood policies in force13 | Homes with a policy0.07% | Median year built2013 | Built before 198015% |
| 37212 | AreaDowntown and Midtown (100% of the land in Metro Nashville's general area) | NFIP claims24 | Total paid$537,511 | Flood policies in force32 | Homes with a policy0.39% | Median year built1969 | Built before 198060% |
| 37208 | AreaNorth Nashville and Bordeaux (100% of the land in Metro Nashville's general area) | NFIP claims21 | Total paid$1,916,200 | Flood policies in force11 | Homes with a policy0.10% | Median year built2003 | Built before 198036% |
| 37228 | AreaNorth Nashville and Bordeaux (100% of the land in Metro Nashville's general area) | NFIP claims10 | Total paid$900 | Flood policies in forcefewer than 5 | Homes with a policyNot shown | Median year built2014 | Built before 198011% |
| 37201 | AreaDowntown and Midtown (100% of the land in Metro Nashville's general area) | NFIP claims7 | Total paid$805,914 | Flood policies in force25 | Homes with a policy1.91% | Median year built2002 | Built before 198039% |
| 37219 | AreaDowntown and Midtown (100% of the land in Metro Nashville's general area) | NFIP claimsfewer than 5 | Total paidNot shown | Flood policies in forcefewer than 5 | Homes with a policyNot shown | Median year built2006 | Built before 198021% |
Source: FEMA OpenFEMA NFIP Redacted Claims v3 and NFIP Redacted Policies v3; U.S. Census Bureau ACS 5-year 2020-2024, tables B25034 and B25035; calculated by Nashville Water Damage & Mold on November 14, 2026. See sources and methods. This product uses the Federal Emergency Management Agency's OpenFEMA API, but is not endorsed by FEMA. The Federal Government or FEMA cannot vouch for the data or analyses derived from these data after the data have been retrieved from the Agency's website(s).
To see the flood zone for one Nashville address, search it on FEMA's Flood Map Service Center, which holds the official maps for Davidson County. The storms behind the busiest claim years are on the Nashville flooding history page, and what to do after creek or storm water gets in is on the flood cleanup in Nashville page.
Cite this page: “Nashville Flood Risk by ZIP: Claims, Policies, Map.” Nashville Water Damage & Mold, https://nashvillewaterdamageandmold.com/nashville-flood-map-by-zip/. Updated November 14, 2026.