
Key facts
- In Nashville's rain record since 1871, the single wettest day is May 2, 2010, when 7.25 in. fell. ACIS daily record, Nashville area climate record (BNAthr)
- Nashville International Airport measured 13.57 inches of rain over May 1 and 2, 2010, more than twice the city's previous two-day record of 6.68 inches from September 1979, according to NWS Nashville. NWS Nashville: May 2010 Flood
- As of November 14, 2026, FEMA lists 3,727 National Flood Insurance Program claims in the 20 Nashville home ZIP codes on this site, and $144,487,437 paid on buildings and contents. FEMA OpenFEMA NFIP Redacted Claims v3
- 1
Nashville's rain record in ACIS, the threaded Nashville Area series, runs from May 1, 1871 to November 17, 2026; it is the National Weather Service's Nashville record, now kept at Nashville International Airport, with rain back to May 1871 and temperatures back to December 1873.
Source: NWS Nashville: Nashville Climate Data (period of record and normals).
- 2
In Nashville's rain record since 1871, the single wettest day is May 2, 2010, when 7.25 in. fell.
Source: ACIS daily record, Nashville area climate record (BNAthr), calculated by Nashville Water Damage & Mold on November 18, 2026.
- 3
Nashville's second-wettest day since 1871 came right before it: September 13, 1979, with 6.60 in..
Source: ACIS daily record, Nashville area climate record (BNAthr), calculated by Nashville Water Damage & Mold on November 18, 2026.
- 4
From 1871 to 2026, Nashville logged 577 days with 1.73 in. of rain or more, which is the wettest 1% of its days.
Source: ACIS daily record, Nashville area climate record (BNAthr), calculated by Nashville Water Damage & Mold on November 18, 2026.
- 5
Of Nashville's days with 1.73 in. or more of rain in the record, 111 came on or after January 1, 2000.
Source: ACIS daily record, Nashville area climate record (BNAthr), calculated by Nashville Water Damage & Mold on November 18, 2026.
- 6
Nashville's record holds 84 days with at least 3 inches of rain between 1871 and 2026.
Source: ACIS daily record, Nashville area climate record (BNAthr), calculated by Nashville Water Damage & Mold on November 18, 2026.
- 7
By calendar year, Nashville's wettest on record is 1979 at 70.12 in., and 1880 follows with 67.32 in..
Source: ACIS daily record, Nashville area climate record (BNAthr), calculated by Nashville Water Damage & Mold on November 18, 2026.
- 8
No month in Nashville's record since 1871 brought more rain than May 2010, with 16.43 in..
Source: ACIS daily record, Nashville area climate record (BNAthr), calculated by Nashville Water Damage & Mold on November 18, 2026.
- 9
Adding up the 1991-2020 monthly normals gives Nashville 50.51 in. of rain in a normal year.
Source: NCEI 1991-2020 normals via ACIS, Nashville record, calculated by Nashville Water Damage & Mold on November 18, 2026.
- 10
By the 1991-2020 normals, May is Nashville's wettest month, averaging 5.02 in..
- 11
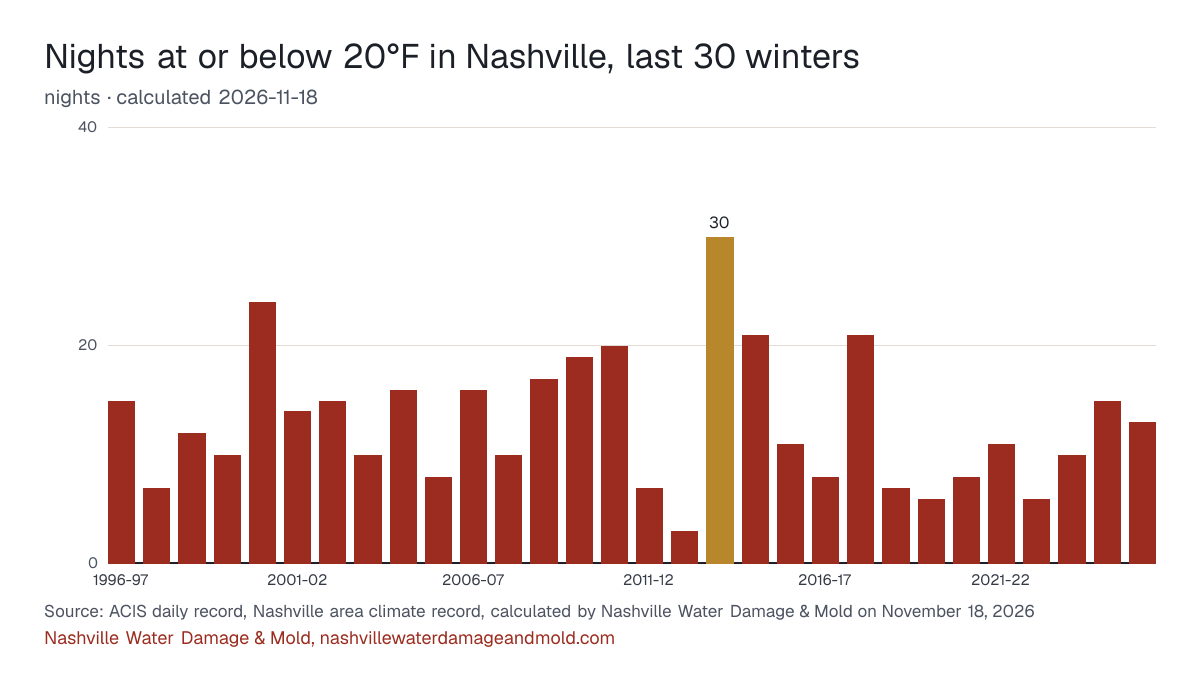
Across the last 30 complete winters, Nashville averaged 13 nights a winter at or below 20°F, the outdoor reading at which unprotected pipes start to freeze.
Source: ACIS daily record, Nashville area climate record (BNAthr), calculated by Nashville Water Damage & Mold on November 18, 2026.
- 12
Nashville's 2025-26 winter brought 13 nights at or below 20°F, and the coldest of them reached 8°F.
Source: ACIS daily record, Nashville area climate record (BNAthr), calculated by Nashville Water Damage & Mold on November 18, 2026.
- 13
NWS Nashville lists the city's record low as -17°F, set in January 1985, and its record high as 109°F, set in June 2012.
- 14
Nashville International Airport measured 13.57 inches of rain over May 1 and 2, 2010, more than twice the city's previous two-day record of 6.68 inches from September 1979, according to NWS Nashville.
Source: NWS Nashville: May 2010 Flood.
- 15
February 2019 was Nashville's wettest February on record, with 13.47 inches through Feb. 27, according to NWS Nashville.
Source: NWS Nashville: Late February 2019 Historic Rainfall and Widespread Flooding.
- 16
Mill Creek at Woodbine in south Nashville crested at a record 21.77 feet on May 1, 2010, against a minor flood stage of 14 feet, according to the National Weather Service.
- 17
Sevenmile Creek at Blackman Road in Nashville reached 15.09 feet on March 28, 2021, its highest level on record, according to NWS Nashville.
Source: NWS Nashville: March 27-28, 2021 Major Flash Flooding.
- 18
As of November 14, 2026, FEMA lists 3,727 National Flood Insurance Program claims in the 20 Nashville home ZIP codes on this site, and $144,487,437 paid on buildings and contents.
Source: FEMA OpenFEMA NFIP Redacted Claims v3, calculated by Nashville Water Damage & Mold on November 14, 2026.
- 19
The 16 Nashville ZIP codes that lie mostly in Metro's general area account for 2,632 of those NFIP claims, by FEMA's records as of November 14, 2026.
Source: FEMA OpenFEMA NFIP Redacted Claims v3, calculated by Nashville Water Damage & Mold on November 14, 2026.
- 20
By FEMA's records, 2010 is the year of loss with the most NFIP flood claims in Nashville's home ZIP codes, 1,697, ahead of 2021 with 441.
Source: FEMA OpenFEMA NFIP Redacted Claims v3, calculated by Nashville Water Damage & Mold on November 14, 2026.
- 21
Among the Nashville home ZIP codes on this site, 37211 (Nashville (Metro)) has the most NFIP flood claims, 682, in FEMA records pulled November 14, 2026.
Source: FEMA OpenFEMA NFIP Redacted Claims v3, calculated by Nashville Water Damage & Mold on November 14, 2026.
- 22
Total NFIP flood payments are largest in ZIP 37211 (Nashville (Metro)), at $22,002,658, among Nashville's home ZIP codes in FEMA records pulled November 14, 2026.
Source: FEMA OpenFEMA NFIP Redacted Claims v3, calculated by Nashville Water Damage & Mold on November 14, 2026.
- 23
On September 1, 2026, 3,074 residential NFIP flood policies were in force in Nashville's 20 home ZIP codes, covering about 1.2% of homes, by FEMA's records.
Source: FEMA OpenFEMA NFIP Redacted Policies v3, calculated by Nashville Water Damage & Mold on November 14, 2026.
- 24
Census ACS 5-year 2020-2024 estimates put about 44% of housing units in Nashville's 16 mostly-Metro ZIP codes as built before 1980.
Source: U.S. Census Bureau, ACS 5-year 2020-2024, tables B25034 and B25035, calculated by Nashville Water Damage & Mold on November 14, 2026.
- 25
FEMA's declarations data names Davidson County in 24 weather-related disaster or emergency declarations, the latest being DR-4898 (severe winter storm).
Source: FEMA OpenFEMA Disaster Declarations Summaries v2, calculated by Nashville Water Damage & Mold on November 14, 2026.
Hard-freeze nights, winter by winter
Of the last 30 winters in Nashville's climate record, 2013-14 had the most nights at or below 20°F: 30.
The numbers behind the chart
| Winter | Nights |
|---|---|
| 1996-97 | 15 |
| 1997-98 | 7 |
| 1998-99 | 12 |
| 1999-00 | 10 |
| 2000-01 | 24 |
| 2001-02 | 14 |
| 2002-03 | 15 |
| 2003-04 | 10 |
| 2004-05 | 16 |
| 2005-06 | 8 |
| 2006-07 | 16 |
| 2007-08 | 10 |
| 2008-09 | 17 |
| 2009-10 | 19 |
| 2010-11 | 20 |
| 2011-12 | 7 |
| 2012-13 | 3 |
| 2013-14 | 30 |
| 2014-15 | 21 |
| 2015-16 | 11 |
| 2016-17 | 8 |
| 2017-18 | 21 |
| 2018-19 | 7 |
| 2019-20 | 6 |
| 2020-21 | 8 |
| 2021-22 | 11 |
| 2022-23 | 6 |
| 2023-24 | 10 |
| 2024-25 | 15 |
| 2025-26 | 13 |
Each heavy rain day behind these figures is ranked on the Nashville flooding history page; claims, flood policies and home age ZIP by ZIP are on the Nashville flood risk by ZIP page.
Cite this page: “Water Damage in Nashville: the Numbers.” Nashville Water Damage & Mold, https://nashvillewaterdamageandmold.com/nashville-water-damage-numbers/. Updated November 18, 2026.