
What happened, from official sources
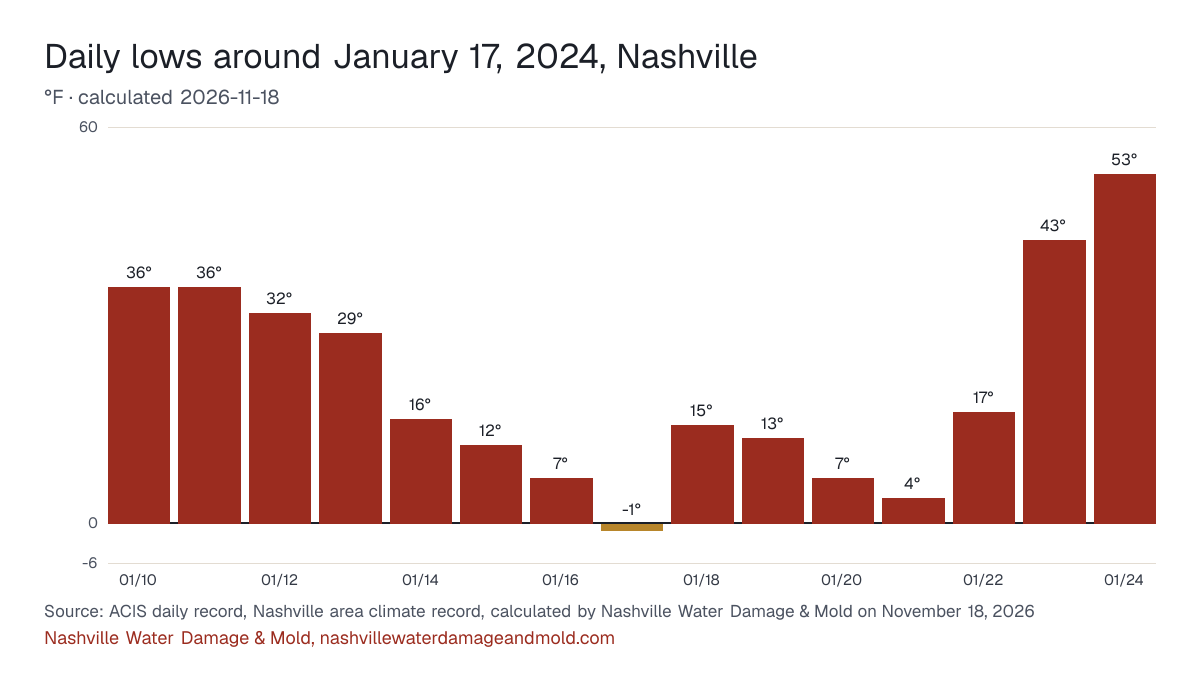
A winter storm on Jan. 15 and 16, 2024 left 7.6 inches of snow at Nashville International Airport, the city's official climate site, more than Nashville usually gets in a whole winter, NWS Nashville reported. Days below freezing followed, and another Arctic air mass brought single digits and readings below zero to parts of Middle Tennessee on Jan. 20 and 21.
Sources: NWS Nashville: January 14-21, 2024 Snow & Arctic Cold
Key facts
- Nashville's climate record shows a low of -1°F on January 17, 2024 (calculated by Nashville Water Damage & Mold on November 18, 2026). ACIS daily record, Nashville area climate record
- That ranks 68th coldest among all 55,687 days in the record since 1871, and 45th coldest among the 4,712 January days on file (calculated by Nashville Water Damage & Mold on November 18, 2026). ACIS daily record, Nashville area climate record
- The night was part of a run of 9 consecutive nights at or below 20°F, the outdoor temperature at which unprotected pipes begin to freeze (IBHS, via the International Code Council). ICC eNews (2014), citing IBHS research on when pipes freeze
- The normal January low is 30.1°F (1991-2020 normals), so the night came in 31 degrees below it (calculated by Nashville Water Damage & Mold on November 18, 2026). ACIS daily record, Nashville area climate record
Lows on the days around it
Nashville's daily low from seven days before to seven days after January 17, 2024, with the report day picked out.
The numbers behind the chart
| Date | Rain | Low |
|---|---|---|
| January 10, 2024 | 0.00 in. | 36°F |
| January 11, 2024 | 0.00 in. | 36°F |
| January 12, 2024 | 1.10 in. | 32°F |
| January 13, 2024 | 0.00 in. | 29°F |
| January 14, 2024 | 0.17 in. | 16°F |
| January 15, 2024 | 0.55 in. | 12°F |
| January 16, 2024 | 0.00 in. | 7°F |
| January 17, 2024 | 0.00 in. | -1°F |
| January 18, 2024 | 0.12 in. | 15°F |
| January 19, 2024 | 0.00 in. | 13°F |
| January 20, 2024 | 0.00 in. | 7°F |
| January 21, 2024 | 0.00 in. | 4°F |
| January 22, 2024 | 0.00 in. | 17°F |
| January 23, 2024 | 0.00 in. | 43°F |
| January 24, 2024 | 0.69 in. | 53°F |
The five closest days in the record
| Date | Low |
|---|---|
| December 23, 2022 | -1°F |
| January 19, 1994 | -1°F |
| December 24, 1989 | -1°F |
| January 22, 1984 | -1°F |
| January 19, 1984 | -1°F |
Federal disaster declarations
No FEMA weather declaration naming Davidson County covers this date.
Source: FEMA OpenFEMA Disaster Declarations Summaries v2.
History, not a forecast: the ZIPs with the most flood claims
For context only, as history rather than a forecast: the three Nashville ZIPs on this site with the most NFIP flood claims across all years, not claims from this day.
- ZIP 37211: 682 claims on record
- ZIP 37215: 408 claims on record
- ZIP 37204: 403 claims on record
Source: FEMA OpenFEMA NFIP Redacted Claims v3, calculated by Nashville Water Damage & Mold on November 14, 2026. Each ZIP's numbers are on the Nashville flood risk by ZIP.
What to check at home after a day like this
- Tonight's low reaches 20°F or colder. Open sink cabinets on outside walls, let those faucets drip, and keep the heat set where it is overnight.
- Close crawl space vents and wrap any pipe you can reach under the house; open crawl spaces and outside walls are where lines split first.
- If a pipe bursts, close the house valve first, then open a faucet on the bottom floor to drain pressure while you call.
The printable emergency checklist and the burst and frozen pipes in Nashville page have the full steps.
Sources: ACIS daily record for the Nashville area climate record (BNAthr), the National Weather Service's Nashville record, now kept at Nashville International Airport, with rain back to May 1871 and temperatures back to December 1873; NCEI 1991-2020 normals via ACIS; FEMA OpenFEMA. Method and the report rule: sources and methods.
Cite this page: “Nashville storm report: -1°F low, January 17, 2024.” Nashville Water Damage & Mold, https://nashvillewaterdamageandmold.com/nashville-flooding-history/2024-01-17/. Updated November 18, 2026.